Analytics & Reporting

Quickly understand key trends in your service with easy-to-use tools.

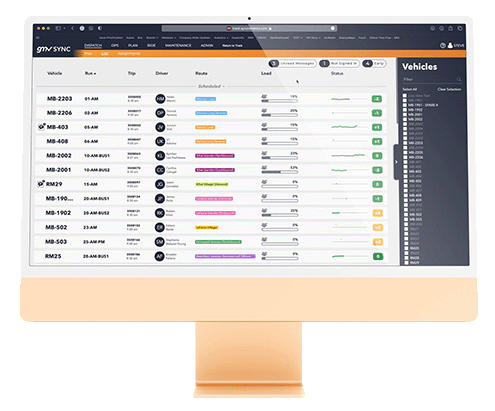
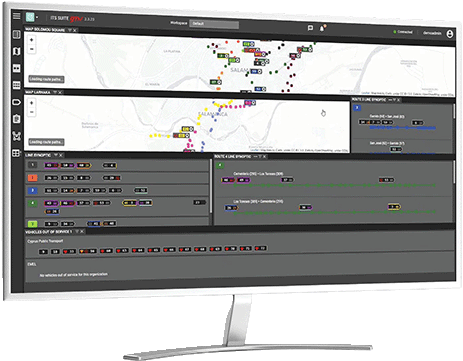
Sync’s Insights Builder provides the most user-friendly way to build reports and an API for third party integrations, while ITS Suite includes native integrations with Microsoft Business Central and other business intelligence tools.

Your transit operation produces valuable ridership and service data, but it can be hard to organize and interpret it all in a meaningful way. Our user-friendly reporting and business intelligence tools remedy that, helping you quickly understand key trends in your service.

These tools collect CAD/AVL system data—on service, ridership, and team performance—and transform it into elegant and easy-to-understand reports. The dynamic reports allow you to click through from general trends to more specific data points in interactive charts and graphs. When you’re done, it’s simple to share the information that’s important to your team. Conveniently export your reports in PDF, Excel, and CSV format, or schedule automated emails to your inbox.

Track Your Trends

Follow trends over time with reports sent regularly to your inbox.

Easy to Use

Quickly find the information you need using intuitive filters and date ranges.

Dynamic Dashboards

Drill down to specific data points in clickable charts and graphs.